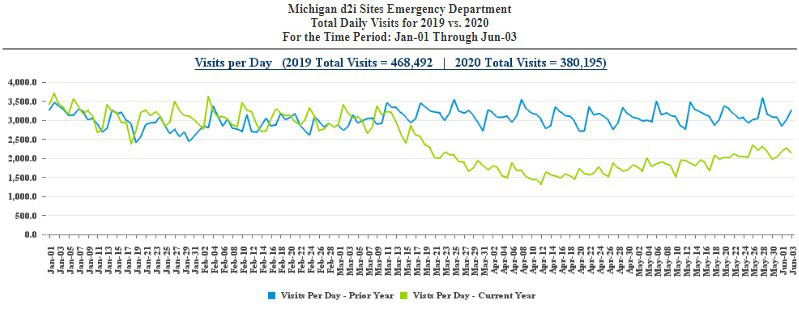
Track and Analyze COVID-19 Patterns at Your Department
Identify trends, extensively filter dimensions, perform correlation tests, and conduct cause and effect analyses with d2i’s COVID-19 Surveillance Analytics.
Contact d2i to fully understand how COVID-19 is impacting your department right now – and how it may change in the future.
About d2i
d2i acquires, normalizes, and curates over 700,000 ED visits per month across 270 hospitals and urgent care clinics. We have nearly 30 million visits in our historical database allowing for year-over-year comparisons, including underlying EHR clinical data, such as:
- Chief complaint
- Diagnosis code
- Outcomes (i.e. admitted to hospital)
- Test performed and results
- and much more…
With d2i, you have the ability to multi-select from a comprehensive filter list, including age group, chief complaint, diagnosis code, location, and more. Our analytics application offers:
- Customizable real-time and historical performance dashboards.
- Detailed reports with unprecedented drill-down and filtering capability.
- Ability to drill down to individual patient charts, subject to HIPAA Privacy Rules for those with Protected Health Information access.
See why no other healthcare analytics tool or EHR system even comes close.
Contact us to speak with one of our domain experts to learn how your department can track and analyze COVID-19, flu-like symptoms, or other critical community health information.
Contact us to learn more about d2i’s COVID-19 Surveillance Analytics.
