Emergency Medicine
Performance Analytics
Our purpose-built drill paths let you access root-cause analysis with just one click.
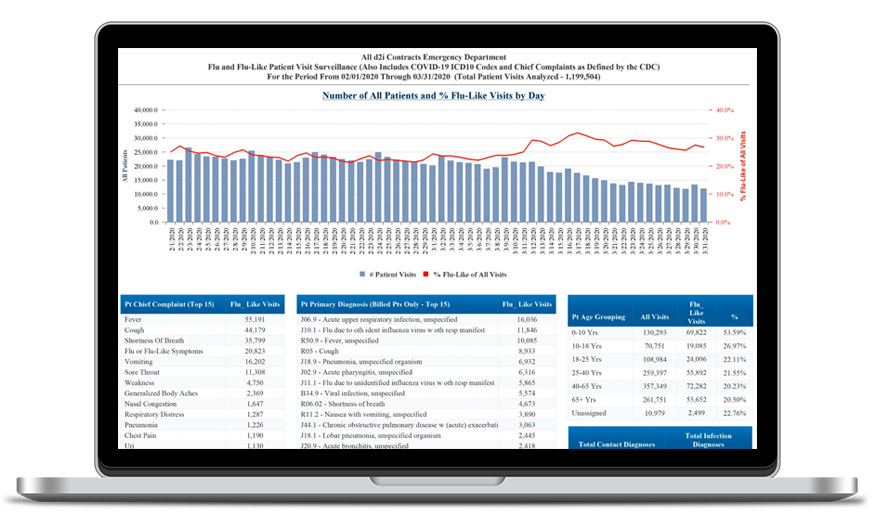
Our comprehensive Emergency Medicine Performance Analytics solution (EMPA) will empower you to lead your practice to greater operational efficiency, quality of care, and profitability. It’s a tool you can use to demonstrate your value and vital role in value-based care.
By leveraging a comprehensive, aggregated, curated, and enriched data set, EMPA provides a 360-degree view of all key performance indicators (KPIs), along with comparisons to industry benchmarks, internal goals, and peers across multiple sites. Using our Balanced Scorecard approach, information can be monitored and analyzed across the operational, clinical, financial, and patient-experience domains.
We embed best practices in the dashboard and analytic workflow to enable dynamic and high-impact performance improvement conversations.
See Detailed Reports With Unprecedented
Drill-Down and Filtering Capability

You’re one click away from causal factors.
d2i’s solutions draw on the Balanced Scorecard model to organize performance metrics. With our EM dashboard, you can monitor your top 10 performance metrics, and with a single click, access a storyboard that presents the details of the causal factors for that metric.
Areas Targeted for Performance Improvement
- Clinical variation and protocol compliance
- Operational effectiveness and efficiency
- Billing completeness and accuracy
- Professional staff productivity
- Malpractice and patient safety risk
- Scheduling optimization
Partial List of Key Metrics
Operations
- Average visits per day
- Admit to IP and admit to observation status, percentage of total visits
- LWBS and AMA (left without being seen and against medical advice)
- Average minutes, from door to first provider
- Median turnaround time (TAT), discharged and admitted patients
- Average wait times
- Average length of stay (ALOS)
Financial
- Cost per visit hour
- Average charge per billed visit
- Average RVUs per doc/APP hour
- Patients billed E&M 99821–99283 where CT, MRI, IV, or ultrasound is utilized
Clinical
- CTs ordered per 100 patients
- Patient arrival time to first antibiotic for relevant diagnostic subgroups
- Patient arrival time to EKG ordered for relevant diagnostic subgroups
- Readmissions
Patient Satisfaction
- NRC Picker scores
- Press Ganey scores
- Number of surveys
- Average patient satisfaction for MD measures only
Sampling of Analytic Storyboards Available out of the Box
- Impact of census on ED crowding, ALOS, and LWBS
- Impact of point-of-care testing on patient flow and quality
- Impact of APP staffing on utilization of various tests, and ALOS and cost/visit hour
- Impact of Alternative to Opioids (ALTO) Initiative on opioid prescribing patterns
- Impact of behavioral health patient census on patient flow and ED crowding
- Impact of fast-track program on patient flow
- Impact of dynamic staff scheduling on patient flow, cost, and ED crowding
- Impact of IP bed availability on ED boarding
- Impact of LWBS and AMA on ED and inpatient revenues
Helping Emergency Departments Improve Performance
d2i offers data analytics solutions to help emergency departments quickly identify and implement opportunities for improvement so that they stay viable in today’s complex health care landscape. See why no other health care analytics tool or EHR system compares:
Analytics purpose-built for Emergency Medicine