Hospital Medicine
Performance Analytics
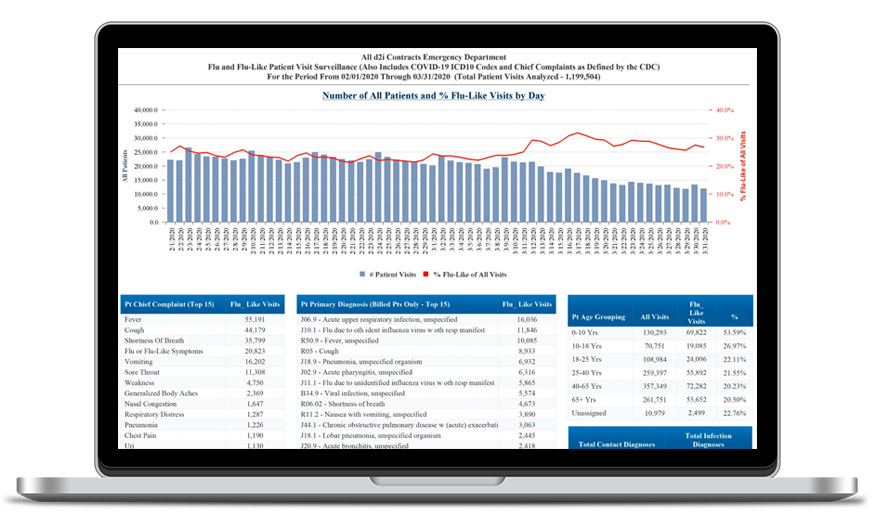
d2i’s purpose-built, intuitive analytics and navigation put key performance metrics at your fingertips.
Our comprehensive Hospital Medicine Performance Analytics (HMPA) solution empowers you to optimize operational efficiency, quality of care, patient safety, and profitability at your hospital. HMPA leverages a comprehensive, aggregated, cleaned, and curated data set to provide a 360-degree view of all of your key performance indicators compared to industry benchmarks, internal goals, sites, and peers.
HMPA’s dashboard layout and purpose-built, intuitive analytics and navigation put key performance metrics at your fingertips so they can be measured, analyzed, and acted upon. Our Balanced Scorecard enables dynamic, high-impact performance improvement conversations across the Operations, Clinical, Financial, and Patient Experience domains.
Since answers to questions lead to new deeper questions, we embed the 5 Whys root-cause analysis into the analytic workflow to ensure actionable insights are always one click away.
You’re one click away from causal factors.

d2i’s solutions draw on the Balanced Scorecard model to organize performance metric information.
Here’s an example of how the 5 Whys are applied in determining underlying causes of performance challenges related to patient flow:
1. Why is boarding in the ED trending higher?
There aren’t any available inpatient beds.
2. Why are there no inpatient beds?
LOS is trending higher.
3. Why has LOS increased?
A high percentage of patient discharge orders are being placed after 11 a.m.
4. Why are a high percentage of patient discharge orders being placed after 11 a.m.?
Physician patient touches have increased, resulting in reduced availability.
5. Why have physician-patient touches increased?
Patient volumes and staffing hours are out of sync.
Areas Targeted for Performance Improvement
- Readmissions
- Practice variation
- Clinical protocol compliance
- Operational effectiveness and efficiency
- Billing completeness and accuracy
- Professional staff productivity
- Malpractice and patient safety risk
- Hospitalist scheduling optimization
Partial List of Key Metrics
Operations
- Admissions (all, CDU, CCU)
- Average length of stay (ALOS)
- Percentage of patient discharge orders written before 11 a.m.
- Patients discharged before noon
- Patient touches per hospitalist by clinical shift
Financial
- Clinician RVUs per hour or patient
- Billed patients per clinician hour
- Clinician hours per day
- Percentage of patients billed as observation care
- Percentage of patients billed as a consultation
Clinical
- All-cause readmissions
- Readmissions by admission diagnostic subgroup (e.g., pneumonia, heart failure)
- Clinical orders written per day
Patient Satisfaction
- NRC Picker scores
- Press Ganey scores
- Number of surveys
- Patient satisfaction for MD measures only
Sampling of Analytic Storyboards Available out of the Box
- Impact of discharge orders written before 11 a.m. on discharge time
- Impact of average patient discharge time on ALOS
- Impact of patient status (IP, obs, consult) on revenue per physician hour
- Impact of ALOS on 30-day readmissions
- Impact of inpatient census and ALOS on ED boarding
- Impact of patients seen per shift on RVUs per work hour
Areas Targeted for Performance Improvement
- Readmissions
- Practice variation
- Clinical protocol compliance
- Operational effectiveness and efficiency
- Billing completeness and accuracy
- Professional staff productivity
- Malpractice and patient safety risk
- Hospitalist scheduling optimization
Partial List of Key Metrics
Operations
- Admissions (all, CDU, CCU)
- Average length of stay (ALOS)
- Percentage of patient discharge orders written before 11 a.m.
- Patients discharged before noon
- Patient touches per hospitalist by clinical shift
- Total discharged patients
Financial
- Clinician RVUs per hour or patient
- Billed patients per clinician hour
- Clinician hours per day
- Percentage of patients billed as observation care
- Percentage of patients billed as a consultation
Clinical
- All-cause readmissions
- Readmissions by admission diagnostic subgroup (e.g., pneumonia, heart failure)
- Clinical orders written per day
Patient Satisfaction
- NRC Picker scores
- Press Ganey scores
- Number of surveys
- Patient satisfaction for MD measures only
Sampling of Analytic Storyboards Available out of the Box
- Impact of discharge orders written before 11 a.m. on discharge time
- Impact of average patient discharge time on ALOS
- Impact of patient status (IP, obs, consult) on revenue per physician hour
- Impact of ALOS on 30-day readmissions
- Impact of inpatient census and ALOS on ED boarding
- Impact of patients seen per shift on RVUs per work hour
Helping Hospitals Improve Performance
d2i offers data analytics solutions to help hospital networks quickly identify and implement opportunities for improvement so they stay viable in today’s complex health care landscape.
See why no other health care analytics tool or EHR system compares:
Analytics purpose-built for Hospital Medicine