Revenue Cycle Management
Performance Analytics
Identify patterns and insights that can help your HCO stay viable in an ever-evolving health care landscape.
Our comprehensive Revenue Cycle Management Performance Analytics (RCMPA) solution helps you monitor, manage, and improve your revenue cycle. With RCMPA, you can look at key performance indicators and quickly identify patterns, trends, and actionable insights that speed cash flow, improve payer contracting, and lead to reductions in denials.
RCMPA’s dashboard layout and intuitive navigation enable dynamic, high-impact performance improvement conversations. Since answers to questions lead to new deeper questions, we use the “5 Whys” process of root-cause problem-solving. It’s embedded into the analytics workflow to ensure actionable insights are always one click away.
You’re one click away from causal factors.

Monitor your top 10 performance metrics, and with a single click of a button, access a storyboard that presents the details of causal factors.
Here’s an example of how the 5 Whys process is used to drill down to the root causes of performance issues:
1. Why are my revenues trending down this quarter?
My denials have gone up considerably.
2. Why have my denials have gone up?
My denials and claim adjustments for UnitedHealthcare patients are higher.
3. Why are my UnitedHealthcare denials and claim adjustments increasing?
Several physicians’ denials and claim adjustments are outliers.
4. Why are those physicians outliers?
Their E&M level coding has increased significantly.
5. Why has their E&M level coding increased?
Their RVUs per patient are the highest in the practice.
Areas Targeted for Performance Improvement
- Cash flow
- Denials
- Time between discharge and final bill
- Billing completeness and accuracy
- Write-offs and adjustments
- Provider productivity
Partial List of Key Metrics
- Total accounts billed
- Total charges posted
- Total payments posted
- Total write-offs
- Percentage of charges adjusted
- Average days to first payment
- Total A/R
- Current A/R days
- Work RVUs billed per provider hour
Sampling of Analytic Storyboards Available out of the Box
- Charges/payments/aging trend correlation in aggregate or by any filter
- Physician comparative performance scorecard
- E&M trend and comparison by group and provider
- E&M correlation to ESI, critical care, IP, and tests ordered
Helping Emergency Departments Improve Performance
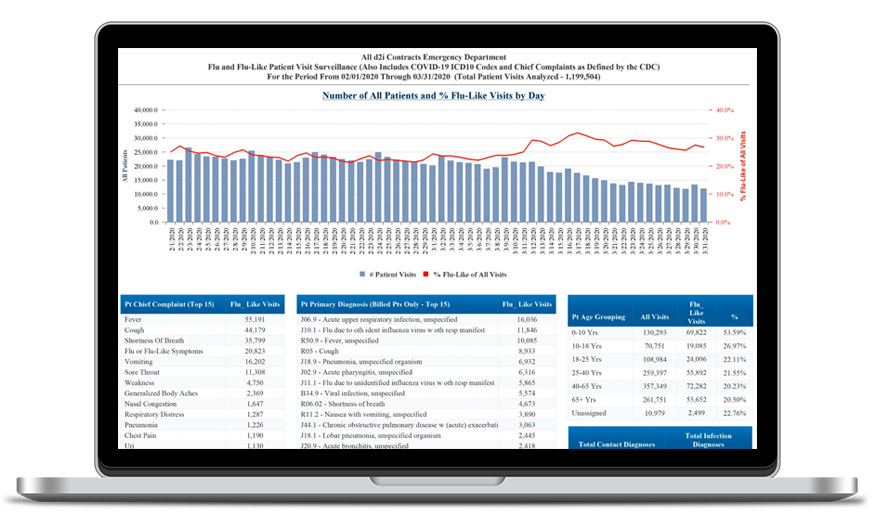
d2i offers data analytics solutions to help emergency departments quickly identify and implement opportunities for improvement so that they stay viable in today’s complex health care landscape. See why no other health care analytics tool or EHR system compares:
Analytics purpose-built for Emergency Medicine