Accelerating Sustainable Emergency Department Process Improvements with Performance Analytics
Summary
As health care moves from fee-for-service to value-based care, the pressure on Emergency Departments (EDs) to improve quality, reduce costs, and provide a superior patient experience is intensifying. Moreover, with ED visits expected to decline after 50 years of uninterrupted growth due to growing competition and increasingly adverse health plan design, competing on value is imperative. Performance analytic applications offer significant opportunities for accelerating the implementation of process improvement projects and establishing a sustainable lean-management approach that leads to an improved ED value proposition. This white paper draws on an ED’s experience with comprehensive analytics-enabled process improvement.
Introduction
Population health, predictive analytics, clinical decision support, and AI (artificial intelligence) currently lead health care’s hype list of innovative big-data strategies. However, with the passage of the Affordable Care Act, MACRA, and the Centers for Medicare and Medicaid’s implementation of value-based purchasing arrangements in Medicare, operational performance improvement has become imperative for health care organizations.
To support value-based purchasing, performance improvement initiatives require that data be aggregated, harmonized, and analyzed from many perspectives – operational efficiency, cost, clinical practice variation, quality, and patient satisfaction. However, the effective implementation of rapid and continuous operational performance improvement has been elusive due in large part to the complexity of curating disparate data in order to make it fit for purpose. This data curation is necessary in order to understand the cause, effect, and impact various metrics have across domains. The ability to understand the impact of particular measures is key. Dr. Edwards Deming, the leading thinker on quality management, famously said, “Measurement without the opportunity to improve is harassment,” and certainly physicians, already burned out from EMR and regulatory fatigue, don’t need projects without clear benefits.
Performance analytics, which provides access to key operational metrics and analytic capabilities, is a big-data approach to addressing these imperatives. Turning that approach into an improvement strategy requires developing a methodology for using data.
Process improvement is a data-intensive methodology. Traditionally, significant time and effort must be spent on manually capturing process performance data, making improvement hard to achieve and harder yet to sustain.
This paper discusses a process improvement project in an ED that had previously implemented a performance analytics application. The project goal was to achieve operational improvement and to test the value of this big-data operations improvement strategy.
Case Study
The ED is in an urban hospital in a metropolitan area that prides itself on its delivery of high-quality care. The hospital recently received CMS’s 4-Star quality rating and the Leapfrog Top Hospital Award. The ED sees 65,000 patients a year.
In 2013, the ED started using a performance analytics application that collects data feeds from the hospital Emergency Department Information System (EDIS); Admission, Discharge, and Transfer (ADT); time accounting and billing systems; and patient satisfaction surveys to generate ED process performance metrics and to provide access to a rich set of analytic data for understanding those metrics.
At the start of 2015 (and since key performance metric tracking began in 2013) those metrics showed outstanding performance relative to industry benchmarks:
- 1.2 percent of patients were leaving without being seen
- Overall patient turnaround time for ED visits was averaging 216 minutes
- Patient satisfaction with their ED visits was high
In late 2015, those metrics indicated that patient throughput was slowing, left without being seen percentages were increasing, and patient satisfaction was declining. The ED wanted to use its performance analytics application to reverse these trends.
Process Improvement Project
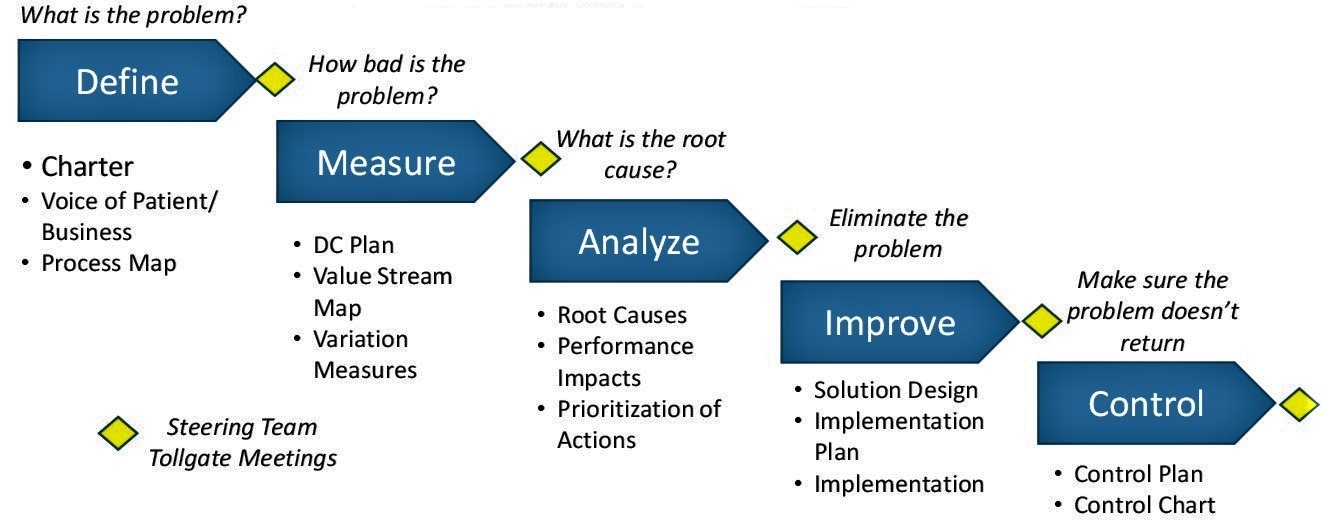
A process improvement project was initiated using Lean Six Sigma principles and DMAIC (Define, Measure, Analyze, Improve, Control) methodology to guide the ED’s performance analytics effort (Figure 1).

Figure 1: Lean Six Sigma DMAIC
A performance baseline and current status profile were quickly Defined with data from the ED performance analytics application, which showed gaps in operational performance metrics from the last quarter of 2014 to a similar period in 2015. The gap analysis showed evidence that process issues were due to both internal and external factors, which is typical of most EDs. While significant increases in hospital direct inpatient admissions were identified as having an impact, a decision was made to focus improvements on fundamentals, that is, on processes internal to the ED.

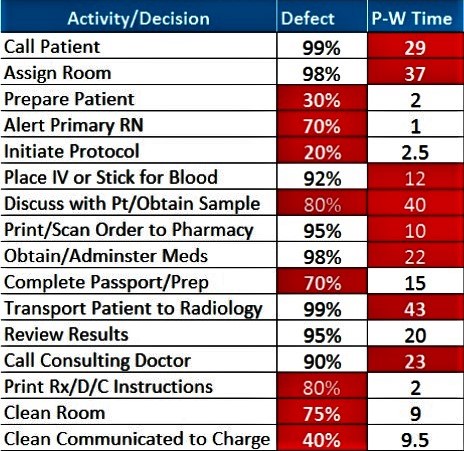
Figure 2 Priority Process Issues
A team of 14 ED technicians, nurses, physicians, and ED managers highlighted the Measure and Analyze steps of the project. First, the team was provided with a value stream mapping as well as an ED performance metrics dashboard.
The team agreed on the flow of patients and work activities from patient arrival to discharge, and established defect and process/work time estimates.
The results were used to identify and prioritize 16 process issues for immediate attention (Figure 2). The team assessed root causes of the 16 process issues, then evaluated the potential impact of 3 best-practice improvement approaches: Direct bedding, team nursing, and team discharge. Finally, they brainstormed other solutions to build a specification for the overall solution, using historical information from performance analytics to project the solution’s potential impact.
For the Improve step, the team agreed on a two-day pilot implementation project to test and refine key elements of the solution. Performance analytic simulations and staff input showed the negative impact of significant on-the-job learning required by staff on the first day. But, by the second day, a new operational rhythm was established. Lessons from the pilot were used to refine the overall solution and it was implemented on June 20, 2016.
Rounding out the DMAIC methodology, Control procedures were established, using daily performance metrics for turnaround times and patients leaving without being seen. Weekly reviews of daily metrics were established to identify and assess out-of-control situations and changes in performance. The new control tools were implemented through the performance analytics application to provide real-time access to information needed to manage performance.
Results

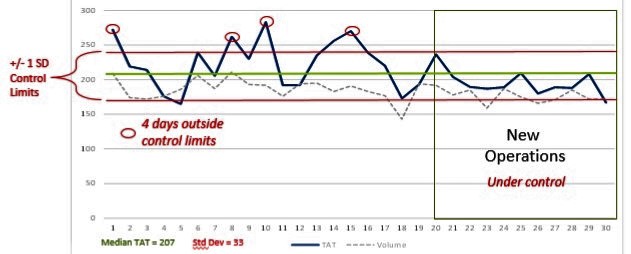
Figure 3: June Turnaround Time (TAT) Results
Initial results of the project were assessed after 11 days of operation in the new setting — from June 20 through June 30. Figure 3 provides a graphic representation of the improvement felt by patients and staff. It shows daily medians for ED patient turnaround times (from arrival to discharge) for each day of the month in the context of overall turnaround time (207 minutes), as well as control limits set to indicate a variation of 1 standard deviation.
Two key changes are noticeable: Less variation in performance and a shorter turnaround time for all patients treated in the ED. These preliminary results were especially encouraging because the changes implemented through the project targeted both of these key objectives. Using a team-based approach led to increased flexibility to respond to peaks in workload, and changes to reduce process delays led to reduced TATs.
Since June, the ED has tracked key performance metrics on a daily basis to sustain gains and further improvement. Figure 4 shows ED performance data from the two months after implementation compared to the two months before.

Figure 4: Comparison Metrics
As the table above illustrates, among discharge-to-home patients — the focus of the project — turnaround times surpassed benchmarks. Not only did turnaround times decrease, this improvement had an impact on reducing the number and percentage of patients who left without being seen.
Most importantly, these results provide a solid foundation for addressing broader external hospital factors that continue to affect ED operational performance.
Putting the results into financial terms, the improvements increased revenue opportunities and reduced operating costs. The reduction in patients leaving without being seen has a potential annual revenue opportunity of $500,000 to $900,000 and the improved turnaround time results have the potential to lower annual nursing costs by $700,000 to $1.2 million.
Conclusions
To be effective, process improvement efforts must involve front-line staff in diagnosing and fixing process problems. Traditionally, that has required the investment of significant time and effort gathering data from the EHR and other sources, interpreting the data to define performance issues, identifying process defects causing poor performance, and evaluating the impact of solutions implemented.
Performance analytics applications are much more efficient and provide easy access to the current and historical data required to diagnose and fix process problems. They provide a more efficient way to involve frontline staff by providing detailed data to quantify performance issues, by facilitating the investigation of the multiple factors causing issues, and by quickly assessing the impact of improvements and refining them.
Together, the two provide both a tool and a transitional approach for implementing a process improvement program in an ED, defining operational metrics most important for managing and improving performance. The performance analytics application tracks metric performance over time and allows for continuous and sustained improvement while helping the team identify new areas for improvement.
Making the connection is important: Process improvement without performance analytics is inefficient and unsustainable. Performance analytics without a process improvement program represents a lost opportunity. Together, the two provide a path for transitioning to a new way of managing ED operations. In a world where ED operational performance is becoming increasingly important for hospitals and health systems, that’s a “big data” strategy with immediate payoff.
About d2i
d2i was founded in 2010 by Scott Richards and Jonathan Rothman, who each have more than 20 years of experience in EM data management and analytics. The company provides a performance analytic application that aggregates, harmonizes, and enriches data from various sources, and provides EM-actionable insights that lead to ED performance optimization.
d2i provides vital services to many of the largest EDs in the U.S. with a cloud-based application that spans the clinical, quality, financial and operational domains.
d2i’s Performance Analytic Application embeds best practices determined by details from more than 17 million ED visits. It requires little up-front cost, no new infrastructure, and can be implemented in a matter of weeks.
In addition to its application, d2i offers analytic services, sharing its extensive industry expertise and organic knowledge to ensure that client partners continue to stay ahead of the curve by rapidly identifying and implementing opportunities for improvement.